Development
- Async callbacks in IntraWeb 15.1
- Creating Custom Content Handlers
- Migrating to IntraWeb XIV and XV
- Using a SA application config file
- Using the Exception Logger
- Using the Session Events Logger
- Working with JavaScript
- Working with Templates
- Working with WebApplication
Using the Exception Logger
|
The new TIWExceptionLogger class (introduced in IntraWeb XIV), when enabled, will log ALL exceptions occurred in your IntraWeb application to a text file, or to the Windows event log. The exception logger may, among other things, save the stack trace to the log file. IntraWeb contains a simplified (and much smaller) version of Jcl (Jedi Code Library) debug units, required to get the application stack trace. You may use another library or framework like EurekaLog or MadExcept to get the application stack trace. If you already use the full Jcl library, you may also use it. This tutorial will show how to enable the TIWExceptionLogger class, and also how to use the simplified version of Jcl to get the application stack trace. 1) Add IWJclDebug and IWJclStackTrace units to your project. The order of the units is not important, actually:
IWJclDebug.pas is a modified version of JclDebug.pas, from Jcl. IWJclStackTrace contains code to get the application stack trace using JclDebug classes.
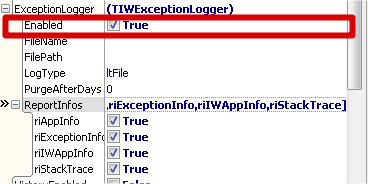
2) Open your ServerController unit and enable ExceptionLogger. This will enable the build-in IWExceptionLogger instance:
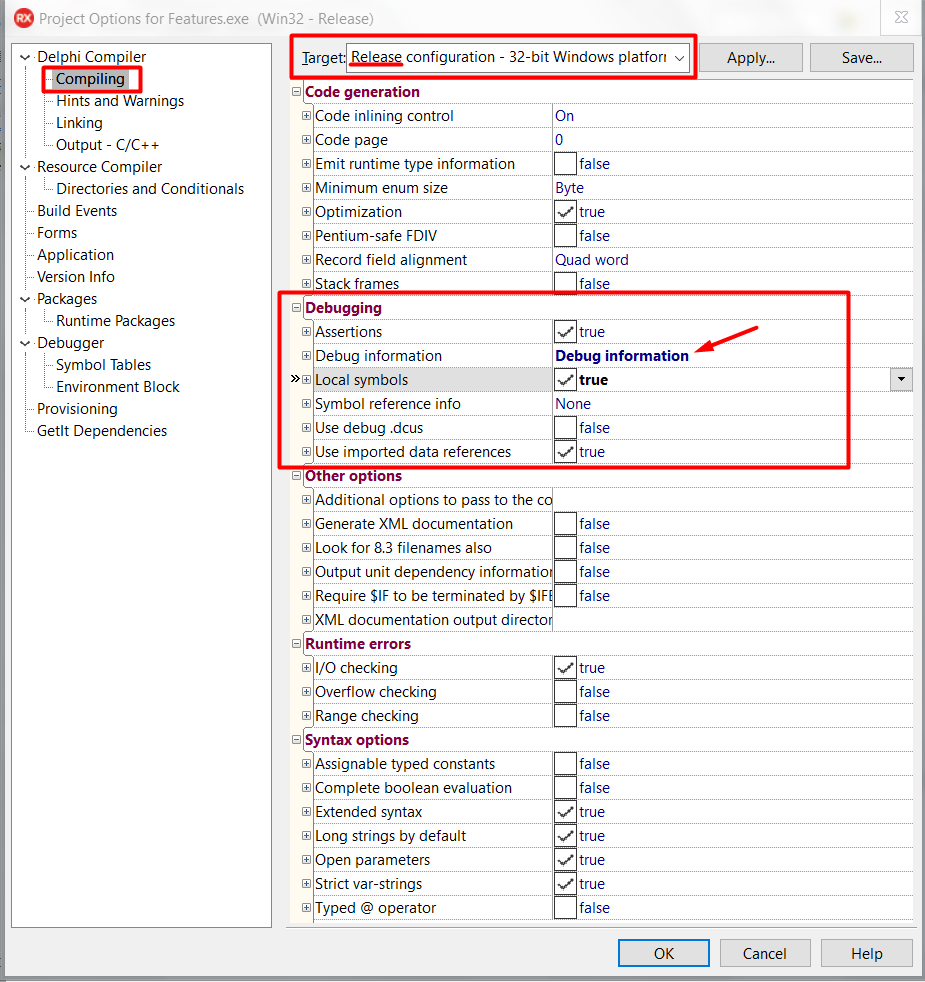
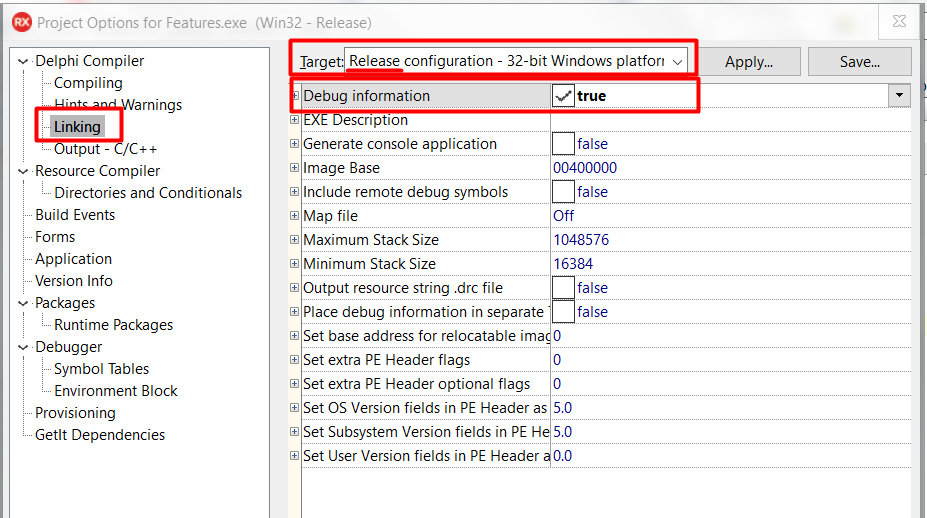
3) In your project options, enable the generation of debug information in both Compiling and Linking options selecting the appropriate RELEASE configuration (32 or 64 bits):
When you enable debug information generation the stack trace will also contain the line number for each procedure/method. From Delphi help: "Debugging information consists of a line-number table for each procedure, which maps object-code addresses into source text line numbers. For units, the debug information is recorded in the unit file along with the unit's object code. Debug information increases the size of unit file and takes up additional memory when compiling programs that use the unit, but it does not affect the size or speed of the executable program." 4) Last step: Build and deploy your application. Whenever a new exception is raised, a log file will be created in a subfolder named ErrorLog (you may also use the Windows Event Log instead of log files). When the stack trace is enabled and ExceptionLogger is configured to save it (riStackTrace = True), the error log file will also contain the application stack trace when the exception occurred. The stack trace may help you to find really hard to reproduce errors, and give you important information about the error. See alsoTIWExceptionLogger class reference
|